So, is AI actually making you more money?
It sounds like a simple question, but most of the time, it isn't.
You might switch on an AI driven optimisation tool and see ROAS improve, sales climb, CPC drop, and conversion rate move in the right direction. That's encouraging. But then someone asks the question that matters most: how much of that growth actually came from the AI?
That's where things get messy.
Demand may have picked up. A competitor might have gone out of stock. Your reviews may have improved, or you could have been running a promotion. Seasonality can move revenue too.
So if you want to prove AI is having an impact, you need to work out what changed because of the optimization itself. That's the part that turns a good looking dashboard into something the business can actually trust.
Start with what would have happened anyway
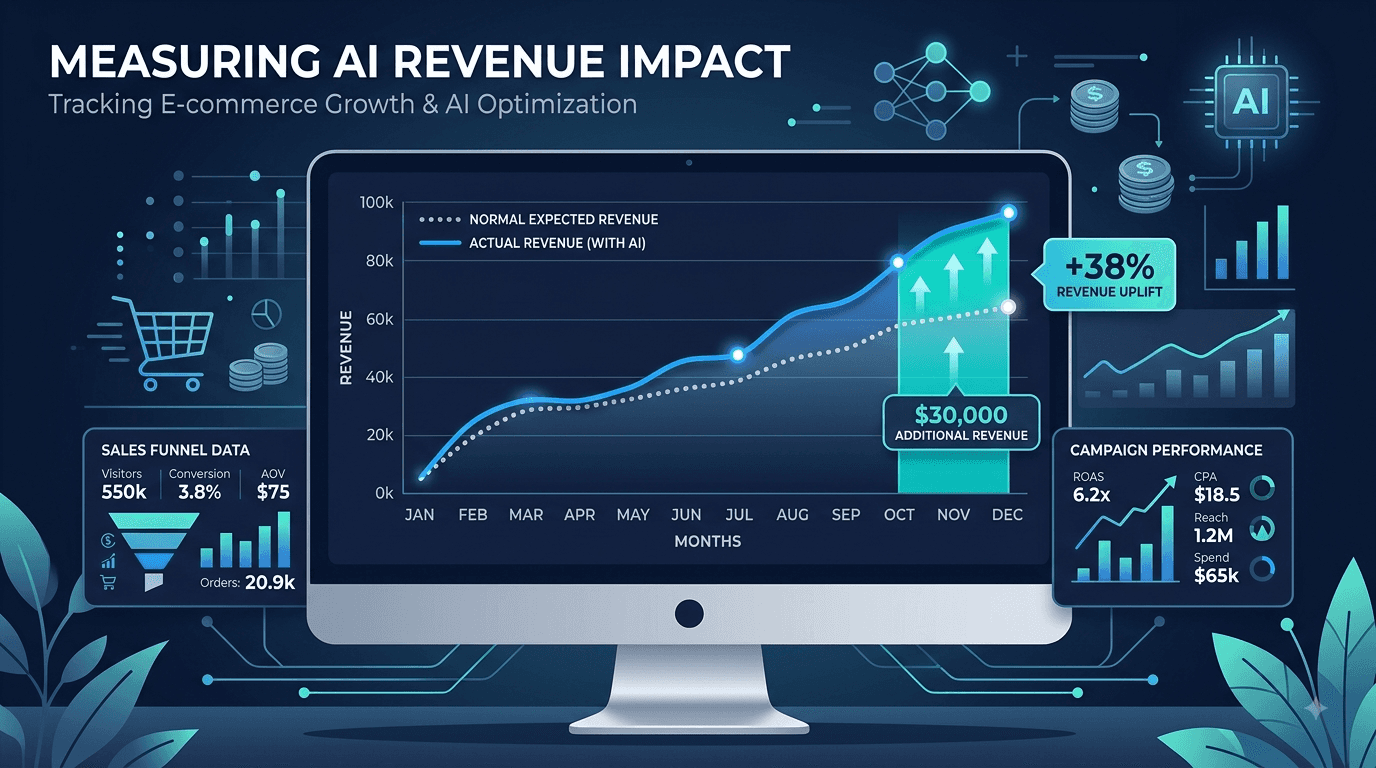
Before you try to prove AI increased revenue, you need a reasonable idea of what revenue would have looked like without it.
Think of this as your normal line.
Say your store usually makes £300,000 a month, then jumps to £360,000 after AI optimisation starts. It's easy to point at the extra £60,000 and call it a win.
But what if that period is always your strongest quarter and sales normally rise by around 15 percent anyway?
Now the picture changes.
If you would have expected revenue to reach about £345,000 without any new optimisation, the amount worth looking at is closer to £15,000. It's a smaller number, but it carries much more weight because there's context behind it.
And context is what makes the result believable.
Your baseline doesn't need to be complicated
You don't need a huge data project to get started. Look at a sensible period before AI optimisation began and track the numbers that usually tell you how the business is doing.
Revenue is the obvious place to start, followed by ad spend, conversion rate, margin, ACoS, TACoS, average order value, organic sales, and new customer revenue where those figures matter.
Then look at anything unusual that may have influenced performance. A major sale, a price change, a stock issue, a review spike, or a seasonal jump can all move the numbers.
Once you understand what normal looks like, you've got something useful to compare against.
Create a fair comparison
A before and after view can help, but it often leaves too many questions unanswered.
If you can, create a second group for comparison. You might let AI optimise one set of campaigns while another similar group keeps running under the previous approach. You could also roll AI out across a small group of products first, or compare similar markets where conditions are close enough to be useful.
Say one set of campaigns using AI brings in £120,000 while another comparable set brings in £108,000.
That's a £12,000 gap.
You still need to check spend, pricing, stock, and product mix, but you now have something much stronger than a screenshot showing performance before and after a launch date.
Follow what actually happened
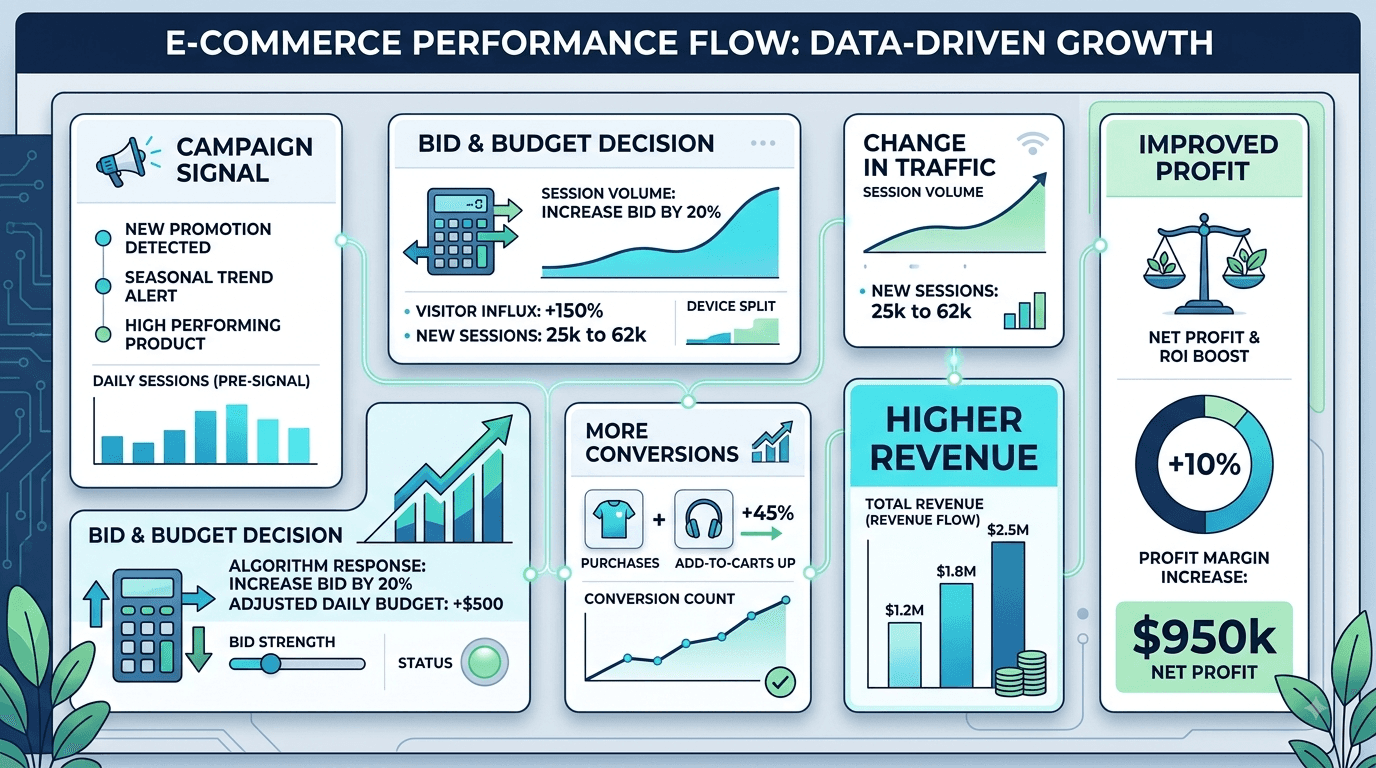
Good reporting should let you trace the path from a decision to an outcome.
Say the system spots that one of your stronger search terms is losing traffic. The bid changes, the campaign starts winning more useful clicks, and those clicks turn into more sales.
That's easy to follow.
Or maybe a campaign is spending too much and producing weak returns. The bid comes down, spend falls, and revenue stays almost the same. You haven't created a big sales spike, but you've improved the economics of the campaign.
That still matters.
This is one reason more frequent optimisation can help. XENA's approach to hourly PPC optimisation focuses on reacting to changes while they're happening instead of waiting for the next weekly review.
Don't let ROAS run the whole conversation
ROAS is useful, but it's easy to lean on it too heavily.
Imagine ROAS rises from 4.0 to 5.0 because spend was cut sharply. The number looks better, yet total revenue may also have fallen.
You can see the reverse too. ROAS might dip slightly while total profit rises because you're reaching more customers at a return the business can still afford.
That's why the wider picture matters.
Revenue, profit, margin, new customer growth, and organic sales all tell you something different. And on marketplaces, paid and organic performance often move together.
XENA's guide to Amazon ad optimisation looks at how decisions around bids, budgets, and keywords can shape overall performance.
Keep an eye on everything else happening at the same time
This is where a lot of AI ROI reports lose credibility.
Let's say AI goes live in April. During the same month, you lower the price, refresh the listing images, gain 300 new reviews, and run a promotion.
Then sales rise by 25 percent.
Giving all that growth to AI would be hard to defend.
Keep a simple record of the major changes happening around the business. Note promotions, pricing changes, stockouts, listing updates, review jumps, and large budget shifts.
It doesn't need to become another reporting headache. Even a basic timeline can help you see what may have influenced the result.
And when someone asks why revenue moved, you'll have a much clearer answer.
Sometimes the win is money you stopped wasting
AI doesn't always show its value through extra sales. Sometimes the clearest result is lower waste.
Imagine you're spending £100,000 a month on ads and the system cuts £8,000 from campaigns that aren't producing enough return. Revenue stays roughly the same.
From a top line view, very little changed. But the business just kept £8,000 that could easily have disappeared into weak traffic.
That has value.
The same applies when a poor keyword gets caught earlier, budget is moved before a campaign burns through it, or bids are reduced as demand starts slowing.
These savings belong in your AI ROI story too.
XENA's wider coverage of AI in ecommerce looks at how AI can support decisions across different parts of an ecommerce business.
Turn the numbers into something people can understand
Once you have a reasonable estimate of extra revenue, work out what it was actually worth.
Say a brand spends £100,000 a month on advertising. Based on seasonality, recent trends, and normal performance, expected revenue is £520,000.
Actual revenue after AI optimisation reaches £555,000.
That gives you £35,000 in potential incremental revenue.
If the contribution margin on that extra revenue is 35 percent, that's £12,250 in contribution. If the AI platform and related support cost £3,000 for the month, the net value comes to around £9,250.
That tells a much clearer story than saying ROAS improved by 12 percent.
You can include staff time saved too, but keep it separate. Saving ten hours a week matters, and so does generating extra revenue. Keeping those figures apart makes the reporting easier to believe.
Keep the scorecard simple
You shouldn't need half an hour to explain whether AI is helping.
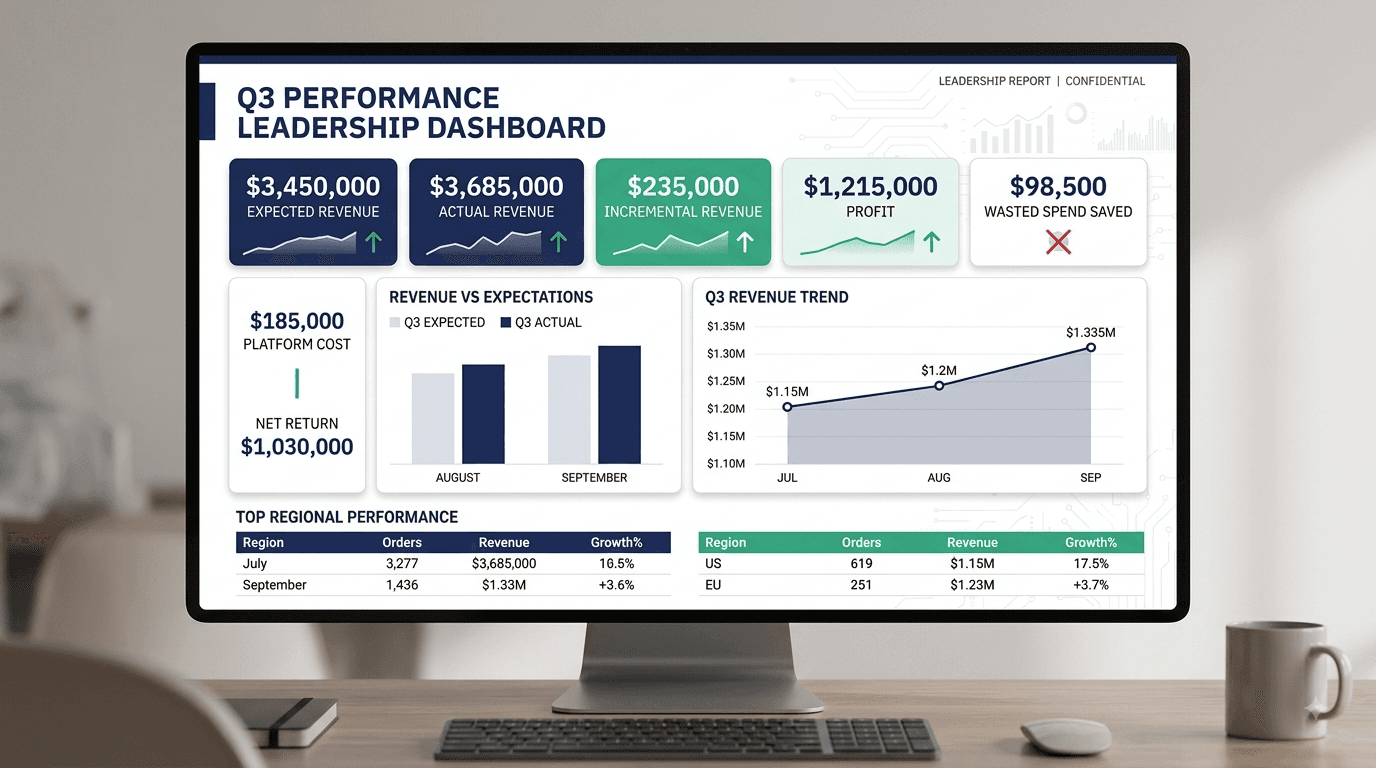
A good scorecard should show what you expected to make, what you actually made, how much extra value can reasonably be linked to the optimisation, what happened to profit, how much spend was saved, and what the platform cost.
Then use supporting metrics to explain the movement.
If CPC improves and conversion doesn't, the product page may need work. If revenue rises and profit stays flat, margin could be the issue. If paid sales rise while organic sales fall, the growth story may be weaker than it first appears.
Simple reporting makes those patterns easier to spot.
Give the system enough data to prove itself
A business might switch on AI optimisation on Monday and want a verdict by Friday.
Sometimes you'll see a clear signal quickly. Often, you won't.
Lower volume products need more time. Seasonal categories can be noisy, and campaign performance can jump around for reasons that have nothing to do with optimisation.
So decide the measurement period before you start. It might be four weeks, eight weeks, or longer depending on sales volume and how quickly useful data builds up.
Then review performance on a steady rhythm.
A single test can show whether something worked during one period. Repeated measurement tells you whether the gains keep showing up.
XENA covers this type of ongoing performance cycle in its AI Commerce Playbook.
Make the story easy to follow
Good AI reporting shouldn't feel mysterious.
Someone should be able to ask what changed and get a clear answer. Which campaigns moved? Where did spend shift? What happened to traffic, conversion, revenue, and profit?
If you can follow that trail, the result becomes much easier to trust.
XENA Intelligence brings performance data, optimisation, and expert support together so ecommerce teams can see what's happening and make faster decisions around growth.
The more visible the path is, the easier it becomes to understand where the gains came from.
So, how do you prove AI is driving revenue?
Start with the number you would have expected without it, then compare that with what actually happened. Account for the other things that may have moved sales during the same period.
From there, work out the extra revenue, the extra profit, the spend you saved, and the cost of the platform.
Keep the explanation simple:
We expected X. We achieved Y. The extra value was Z.
That's the kind of result people can understand quickly, question properly, and use to make better decisions about where AI is helping and where it still needs work.